Integration Data Transformation and Normalization Approaches
Master transformation and normalization to unify data across hundreds of disconnected systems.
Data integration stopped being a background IT chore a while back. Instead, it turned into a discipline with its own budget line, its own vendors, and its own set of arguments about the right way to do things. The core technical problem underneath all of it is data transformation and normalization, the practice of taking data from dozens of different source systems, each with its own schema, field names, formats, and conventions, and converting it into a consistent, usable form that can actually be analyzed, acted on, or fed into a machine learning model without producing garbage output.
Understanding the distinct approaches to this problem, from ETL pipeline architecture to feature scaling for ML to real-time CDC normalization, is increasingly necessary for any engineering or product team building on top of SaaS data.
Data Integration as a Strategic Discipline
Analyst estimates on the size of the data integration market don't agree on a single number, and that's fine, because the range tells its own story: figures for 2026 span a wide range at the lower end up toward a considerably higher figure, with most estimates clustering around a 12-14% compound annual growth rate.
What's changed isn't the market size so much as the job description. Integration used to mean moving data from point A to point B without breaking anything. But now, it's an operational discipline that touches analytics, automation, machine learning, and the decisions leadership makes based on all three. A broken pipeline doesn't just lose a report; it loses whatever downstream system that report was feeding, whether that's a fraud detection model, a sales forecast, or a customer-facing feature.
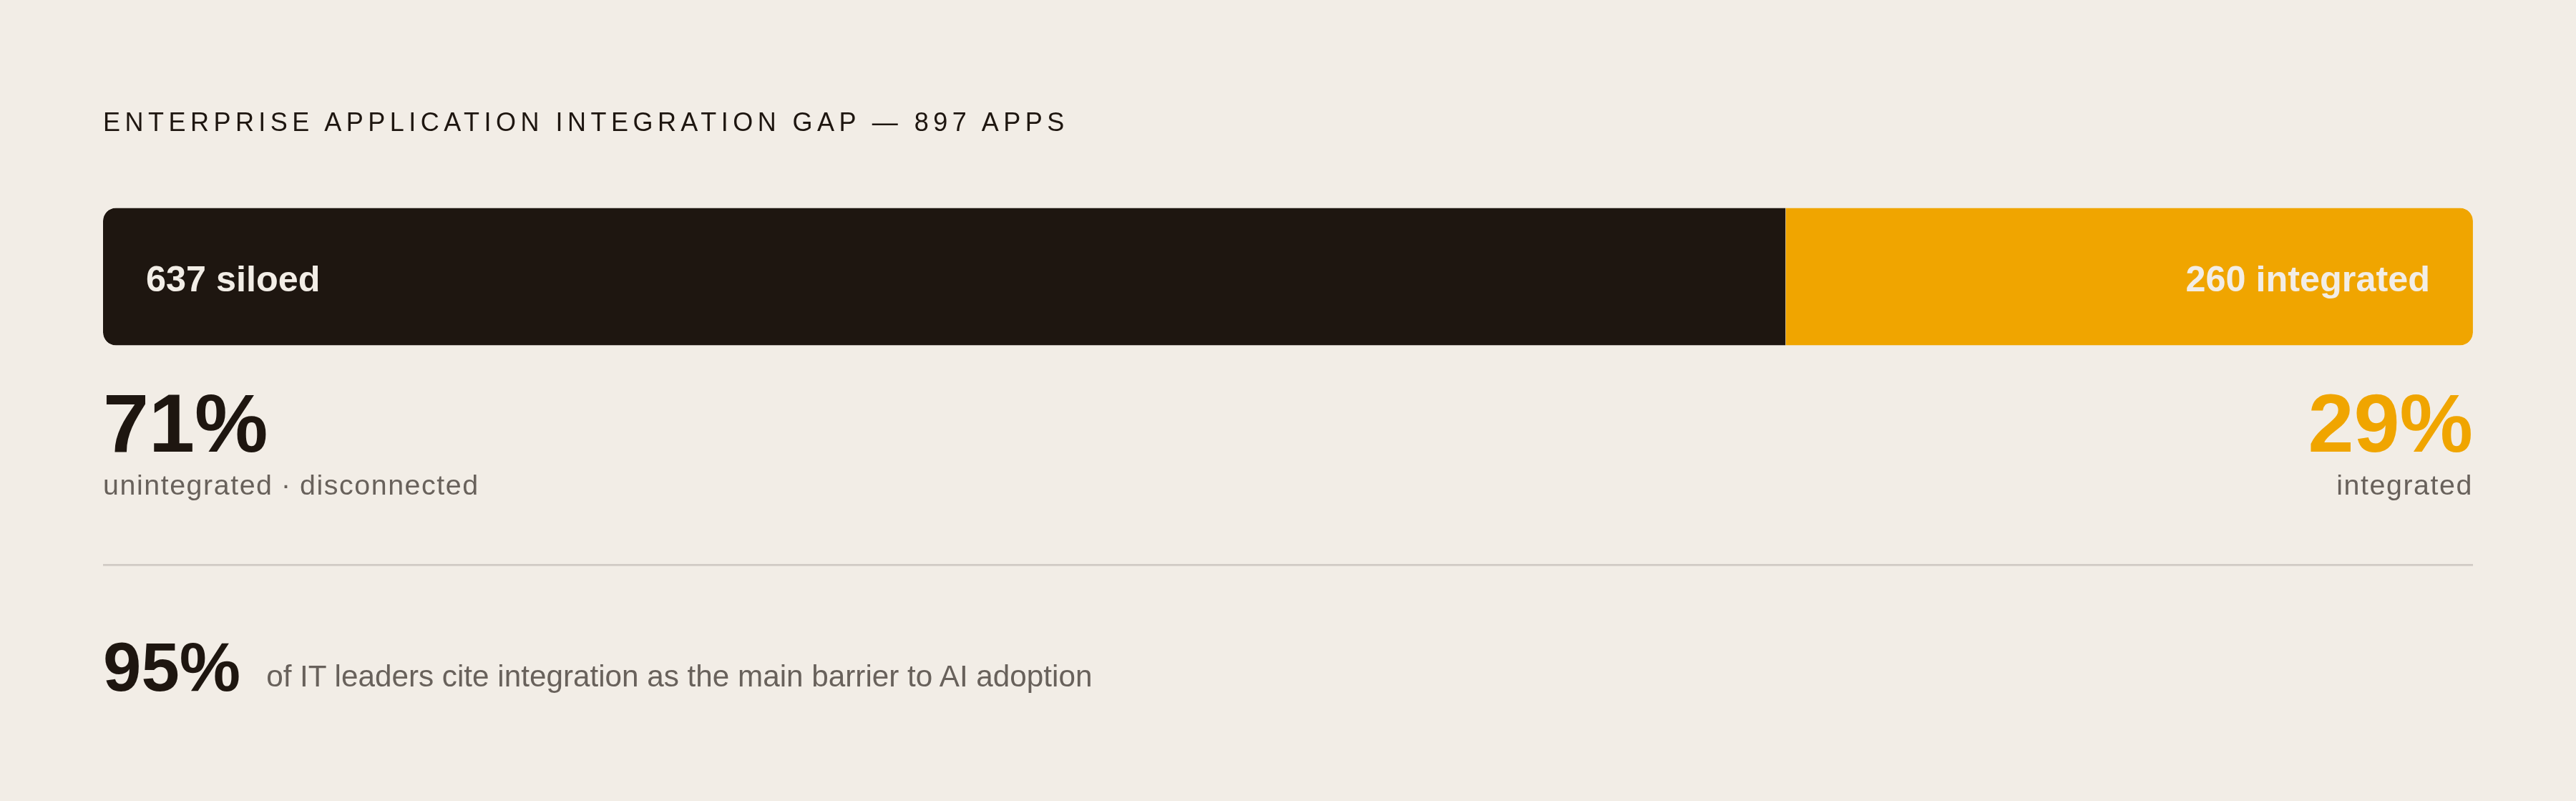
The gap between where companies are and where they need to be is not small. Research from an industry analyst, cited via another platform, puts the average enterprise at 897 applications, with only 29% of them actually integrated, meaning 71% of business software sits disconnected, hoarding data that never reaches the systems that could make use of it.
The AI angle makes the stakes sharper. Roughly 95% of IT leaders point to integration as the main barrier standing between them and real AI adoption, and Gartner predicts that by the end of 2026, 40% of enterprise applications will carry task-specific AI agents, up from under 5% in 2025. Those agents are only as good as what they're fed. An AI agent working from inconsistent, unnormalized data will generate confidently wrong answers at a speed no human analyst could match.
What Transformation & Normalization Actually Mean
Data transformation is the bridge between "we collected some data" and "we can actually do something with this data." It covers cleansing, normalization, and structural conversion, all in service of making information from different systems line up well enough to be combined and analyzed.
Normalization is one piece of that bridge, not the whole structure. It sits alongside standardization, joining, filtering, and aggregation as one of several transformation operations. Teams that treat "normalize the data" as a synonym for "fix the data" tend to over-apply it in places where a simple filter or a join would have done the job with far less overhead.
Part of the confusion is that "normalization" is doing three unrelated jobs depending on who's saying it:
Database normalization is schema design. It eliminates redundancy through a series of formal structural stages, each building on the one before.
Feature normalization (or scaling) is a machine learning preprocessing step. It rescales numbers so a model doesn't treat "revenue in dollars" and "number of logins" as if they belong on the same scale.
Pipeline-level data normalization is about resolving naming mismatches, format differences, and unit conflicts between source systems, so "NY," "N.Y.," and "New York" all land as the same value in a downstream table.
Transformation is the umbrella that reconciles all of it, making sure data from different systems agrees with itself before it moves further down the line.
ETL, ELT, & Reverse ETL Compared
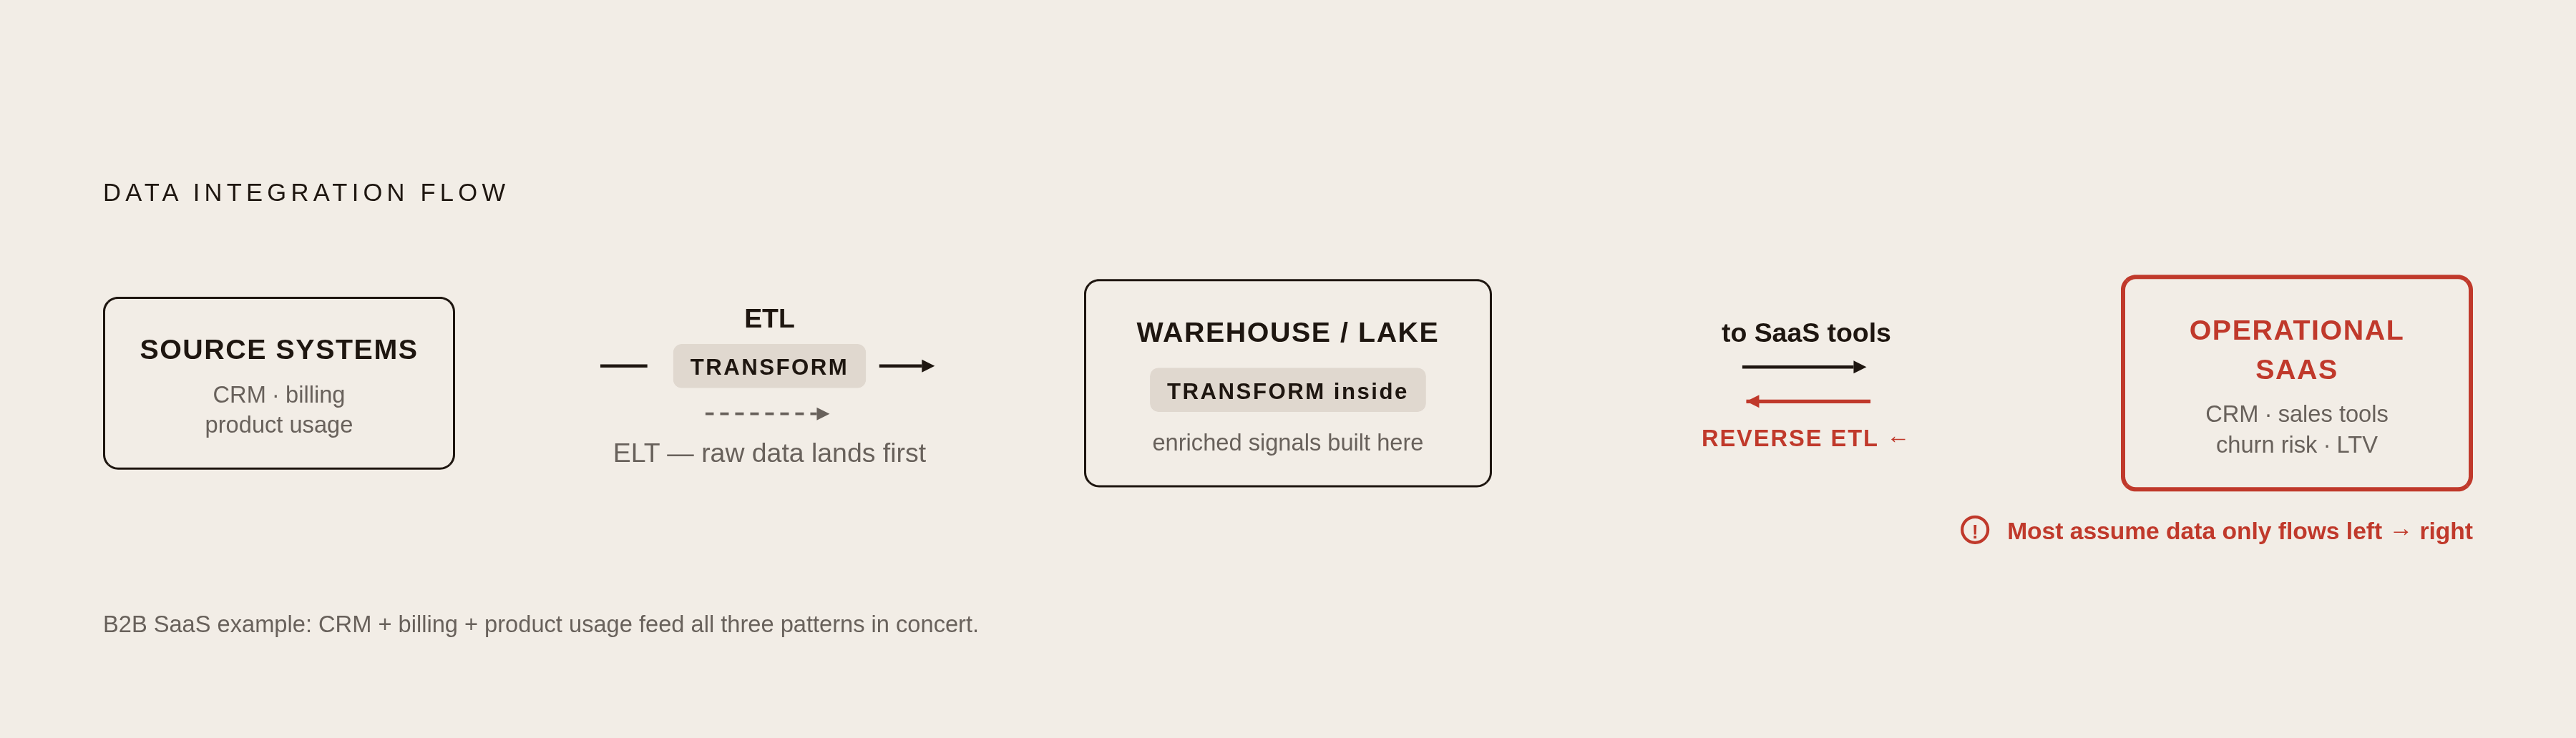
Extract, Transform, Load is the old guard. Data gets cleaned and shaped before it ever lands in its destination. That order still makes sense in legacy systems and regulated industries where validation has to happen before anything gets persisted, because once it's in the system of record, undoing a mistake gets expensive fast. The trade-off is speed: transformation-before-load creates a bottleneck, and it's less forgiving when source schemas shift unexpectedly.
Extract, Load, Transform flips the order and has become the default for cloud-based stacks. Raw data lands in the warehouse or lake first, and transformation happens afterward using SQL or engine-native logic, often through tools like dbt and other transformation-focused platforms. Ingestion is faster and the whole setup scales better, but raw, unpolished data sits in the warehouse longer. Governance and quality checks have to happen after the fact instead of before.
Reverse ETL runs in the opposite direction from both. It takes data that's already been cleaned and enriched in the warehouse and pushes it back out into the SaaS tools that sales, marketing, and support teams actually use day to day. This pattern moves analytics out of reports and directly into the systems frontline teams operate in, such as a CRM showing a customer success rep a calculated churn risk score before a renewal call. As B2B SaaS companies get more serious about surfacing warehouse-calculated signals back into operational tools, this pattern is growing.
Most real-world stacks don't pick one of these exclusively. A B2B SaaS company calculating churn risk from CRM, billing, and product usage data typically needs all three: ELT to get the raw data centralized, transformation to calculate the actual risk score, and Reverse ETL to get that score back into the CRM. Treating this as a choice between ETL, ELT, or Reverse ETL misses the point. Most production environments need all of them working together.
When Formal Database Normal Forms Still Apply
Formal database normalization is a schema design discipline aimed at eliminating redundancy and protecting data integrity, worked out through a progression of increasingly strict structural stages. Applying it in practice means identifying entities and their keys, splitting out repeating groups, moving each fact into the table it actually depends on, connecting the tables with foreign keys, and then testing the whole thing against real queries and real updates.
This still matters most in operational databases, source systems of record, and AI training pipelines that need clean, canonical entity resolution where one customer maps to one row with no duplicates hiding under slightly different spellings. What it's not built for is analytics and reporting. A fully normalized schema forces a reporting tool to chain together many joins just to answer a simple question, which degrades query performance significantly. The common fix is a hybrid: keep raw data normalized for integrity, then build a denormalized reporting layer on top of it for query speed.
Feature Scaling for ML Pipelines
Feature normalization solves a specific problem: getting numerical values onto a common scale so a machine learning model doesn't accidentally treat units as importance. A model that sees a revenue field with values in the hundreds of thousands next to a login count field with values in the tens might quietly decide revenue matters many orders of magnitude more simply because the numbers are larger.
A few standard techniques handle this. Min-max scaling squeezes values into a fixed range, often 0 to 1. Z-score standardization centers everything around the mean with a standard, comparable spread. Log transformation tackles the right-skewed distributions that appear constantly in revenue and usage data, where a handful of outliers can otherwise dominate model training.
This matters most for gradient-based models, distance-based classifiers, and neural networks, which assume their inputs are on comparable scales. Connecting this back to the AI agent expansion that Gartner predicts will reach 40% of enterprise applications by the end of 2026, an agent built on unnormalized features produces unreliable outputs, which is a significant problem when those outputs are driving automated business decisions.
CDC & Streaming Normalization for Live Data
Change Data Capture, or CDC, tracks and forwards only what actually changed in a source system, such as an insert, an update, or a delete, rather than shipping the entire table every time something moves. That keeps replication lightweight and avoids hammering the source system with constant full-table exports.
Normalization has to work differently in this context because CDC events arrive one at a time rather than as a tidy batch. Normalization logic has to run on each individual event as it streams through, rather than on a static snapshot that can be reviewed and corrected before loading. Schema drift compounds this challenge: when a source system silently adds or renames a field, normalization rules downstream can break without any immediate warning, producing quietly incorrect data until someone notices the numbers look wrong.
The streaming analytics market is projected to hit $128.4 billion by 2030, growing at a 28.3% compound annual rate. Real-time integration lets companies spot market trends roughly 30% faster and enables automated compliance monitoring that previously required manual review processes.
Where AI Normalization Helps & Falls Short
Modern transformation engines have gotten genuinely good at catching their own mistakes. Machine learning models embedded in these tools can flag data quality problems as they occur and suggest transformation rules based on patterns they've already seen. AI agents have extended this further, generating mapping rules, aggregation logic, and full normalization workflows from a plain-English description of requirements, without requiring a dedicated engineering sprint.
The numbers here are notable. According to Energent.ai, their platform hit 94.4% accuracy on the HuggingFace DABstep financial analysis benchmark (a self-reported score), ahead of Google's Agent at 88% and OpenAI's Agent at 76%. Energent.ai also reports data analysts saving an average of three hours per day using the tool. Self-reported benchmarks deserve scrutiny, but the gap between the lowest and highest scores is wide enough to indicate meaningful differentiation across tools.
There are clear limits to what AI-assisted normalization can handle. Schema design decisions, such as whether a table should be structured to a stricter normal form or left denormalized for query performance, are logical judgment calls that depend on understanding how the data will be used downstream. Business rule validation requires domain knowledge about what a field value should mean in a specific business context, which no model has access to independently. And conflict resolution in bidirectional sync, deciding which system serves as the authoritative source of truth when two systems disagree on a value, is a governance decision that requires human input. AI tooling accelerates the implementation of normalization logic, but it does not replace the decisions that determine what that logic should be.
Ingestion-Layer Normalization Prevents Downstream Failures
The principle behind quality at entry is straightforward: catch problems where data first arrives in a pipeline, not several transformations later when the origin of a bad value is difficult to trace. Normalizing formats, resolving naming mismatches, and validating fields right at ingestion means bad data gets fixed or flagged before it propagates into downstream systems.
Three practices do most of the work here. Initial validation checks that incoming fields match expected types, ranges, and constraints. Deduplication catches duplicate records the moment they arrive, rather than after they've been copied into multiple reports or aggregations. Lightweight filtering excludes records that fail basic quality thresholds before they enter the pipeline, preventing low-quality data from reaching transformation steps that weren't designed to handle it.
A failure caught at ingestion is a relatively quick fix. A failure caught after it's been joined, aggregated, and built into multiple dashboards is far more costly to diagnose and correct. Transformation logic further down the pipeline cannot reliably compensate for data that should have been caught and corrected at entry.
None of this works without a governance layer that tracks lineage, schema, provenance, and usage history. That layer produces the record of what happened to the data, turning a data quality fix into something traceable and auditable rather than an undocumented change.
Unified APIs Solve the SaaS Normalization Problem
Every SaaS application exposes data differently: different authentication schemes, different schemas, different conventions for basic behaviors like pagination and filtering. Product managers, analysts, and engineers who need to work across multiple tools want a single, consistent data model they can query without needing to write custom integration logic for each source system.
Unified APIs exist to close that gap. They normalize and standardize data across disparate systems, keep pagination and filtering behavior consistent regardless of the source, and translate different schemas into one shared model that behaves the same regardless of which SaaS tool the data originally came from.
Merge.dev's State of Product Integrations report, based on a survey of 160 product managers and engineers at B2B SaaS companies, gives a useful snapshot of where this is headed. Companies plan to keep adding integrations across CRM, communications, project management, applicant tracking, and accounting categories through 2026. Respondents reported that integration data makes their AI outputs more accurate and more personalized, and companies investing in integrations reported higher customer retention and better close rates than those that had not.
The SaaS normalization challenge and the AI readiness challenge are converging on the same underlying problem. An AI feature built on top of a product is only as trustworthy as the integration layer feeding it, and that layer is frequently built on inconsistently normalized fields, undocumented schema assumptions, and transformation logic that was never designed to support the use cases now being built on top of it.