Monitoring and Alerting for Third-Party API Health
Validate output quality and schema changes to catch silent failures status dashboards miss.
Monitoring third-party API health means checking that a dependency both answers and does its job. For AI content pipelines, correct output is the health signal. That requires response validation, model-specific probes, and alerts for silent degradation, because a green uptime dashboard cannot tell whether the pipeline is producing usable work.
Why HTTP 200 is the wrong health signal for AI content pipelines
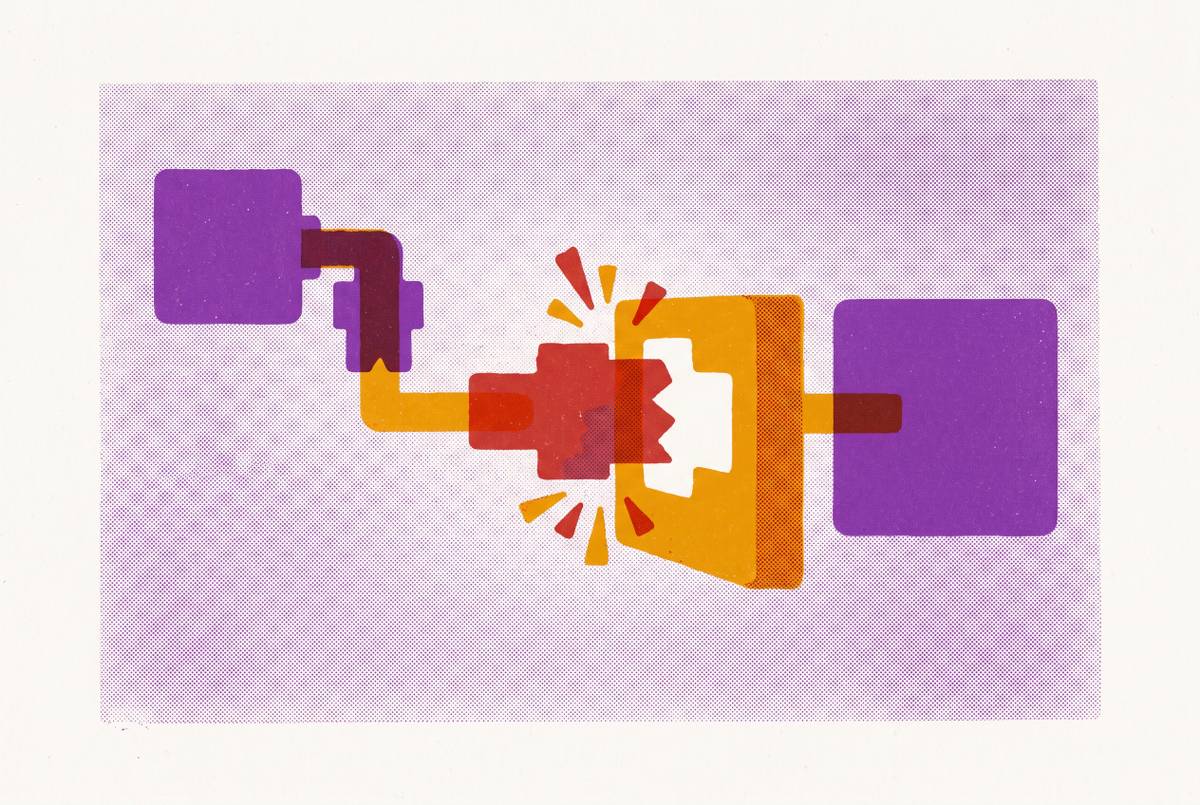
An AI endpoint returns HTTP 200 with an empty choices array, and a content pipeline keeps taking those responses for hours. The uptime monitor stays green the whole time. This is the gap between a server answering and a service working. A status code says nothing about whether the response is complete or usable, so a status-only check has no reason to object.
The same blind spot applies when a successful response contains an error body saying “service unavailable.” The server has sent a sick note in an envelope that says success. Latency can make the distinction equally painful. An API taking 8 seconds on every call is functionally broken for real-time generation, even when every response is technically successful. Server-up, response-wrong failures are where most API incidents originate.
OpenAI, Anthropic, and Google Gemini have had rolling outages in which some models degraded while others stayed available. A provider-wide check cannot tell how the model a pipeline calls is doing. Vendors also write their own status pages, which tend to report incidents too late for systems that serve customers.
What genuine API health monitoring actually checks
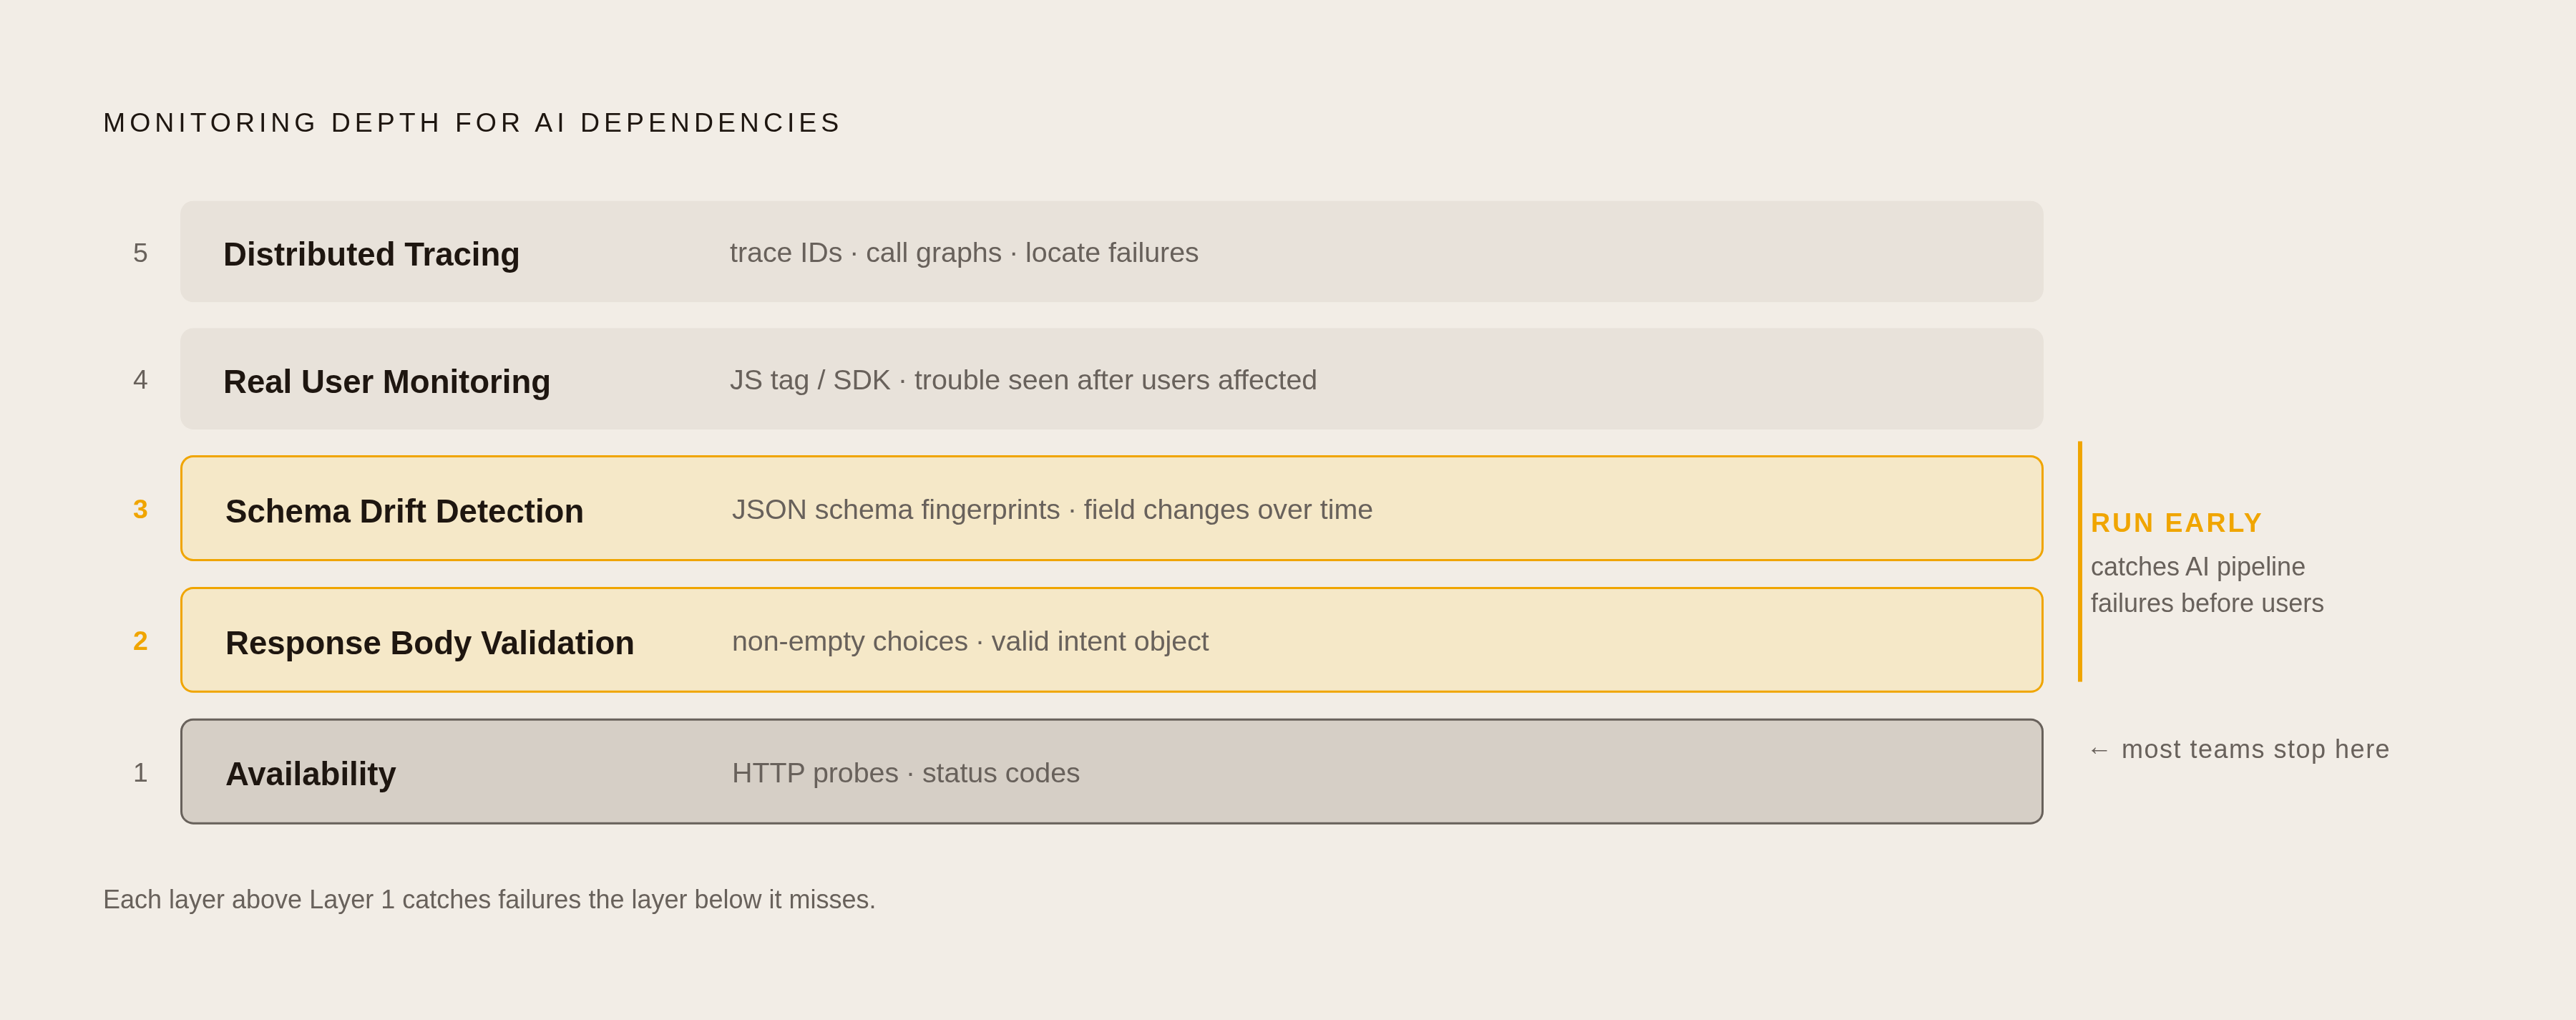
A useful monitoring stack has five layers. Layer 1 checks availability through regular HTTP probes and status codes. Most teams stop at this layer. Layer 2 validates the response body, including whether an AI response has a non-empty choices array with the expected structure or a payment response contains a valid intent object. Layer 3 detects schema drift by comparing JSON schema fingerprints over time for added, removed, renamed, or retyped fields. Presence is not the same as compatibility.
Layer 4, real user monitoring, instruments real traffic, typically through a lightweight JavaScript tag or SDK in the page, but only exposes trouble after users are affected. Layer 5, distributed tracing, propagates trace IDs to build call graphs and locate failures or slowdowns within a request. For third-party AI dependencies, Layers 2 and 3 are the most useful checks to run early. They catch output failures that availability checks miss and downstream observation catches too late.
Latency monitoring should track p95 against a meaningful threshold. An endpoint returning 500 on 1% of calls can look healthy to an occasional probe, so error-rate monitoring needs volume. Rate-limit headers or usage metrics also warn when the pipeline is getting close to the 429 wall. Availability alone supplies none of this context.
Why schema drift is the primary failure mode for third-party APIs
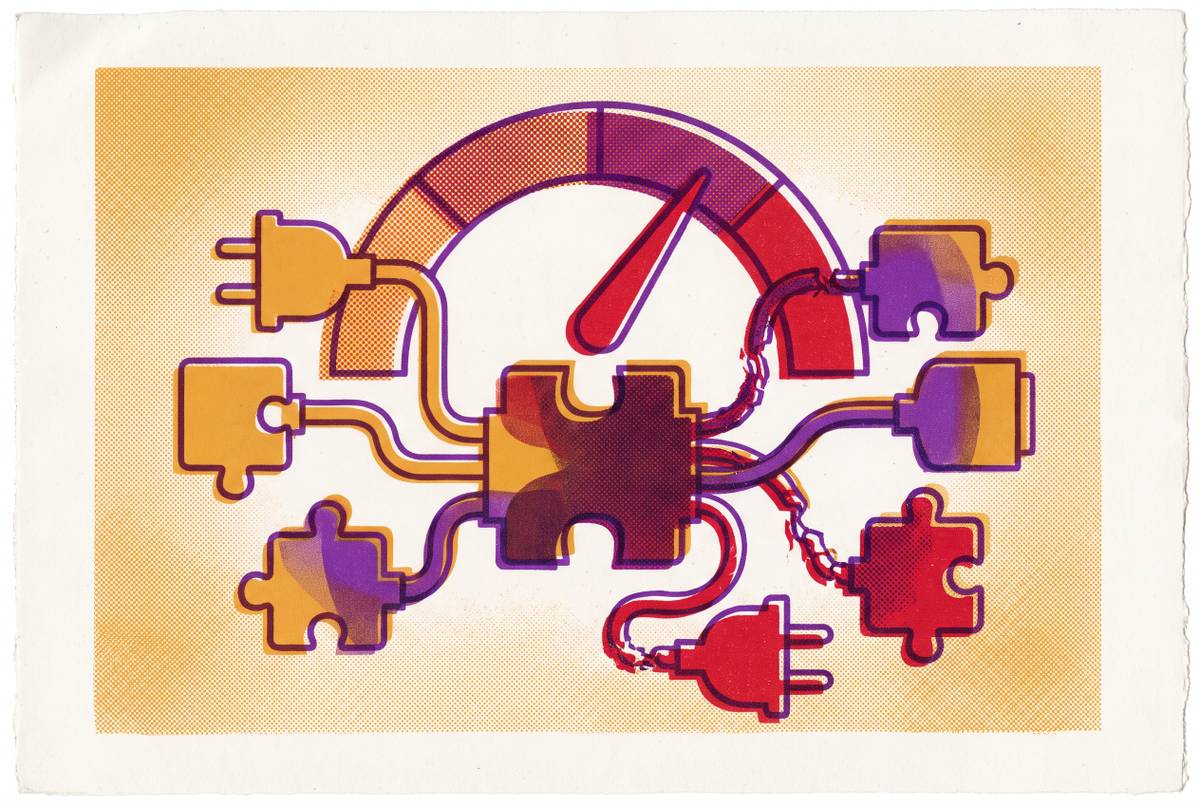
The team shipping internal API changes can tell others about them ahead of time. Third-party changes can come without that conversation. A renamed field, a changed type, or a change to the set of accepted values may break a consumer without a clear error. The first visible symptom can be wrong downstream output, making schema drift a workflow problem.
Dependency tools do not close this gap. Dependabot tracks library version changes, leaving a SaaS platform changing API behavior, deprecating a model, adjusting rate limits, or changing authentication flows outside its scope. Vendor changelogs, documentation updates, or status posts may warn of those risks before they show up in code. Continuous response checks and changelog monitoring therefore serve different purposes. One detects what changed in practice, while the other can expose a change before it reaches production.
A useful change-tracking practice starts with a reliable source map covering official changelogs, RSS/Atom feeds, deprecation pages, GitHub releases, security advisories, documentation release notes, and pricing pages. Each update retains its original URL and timestamp. A common record then captures the vendor, product area, title, source URL, published date, summary, tags, severity, and action needed. That makes unlike announcements comparable without erasing their provenance.
The alert filter is just as important. Changes deserve attention when they can break production, change cost, require migration, affect compliance, or alter an integration. A vendor post, GitHub issue, and official changelog describing the same change are duplicates. The canonical source should remain auditable later, so the system produces obligations.
How multi-model AI pipelines multiply the monitoring surface
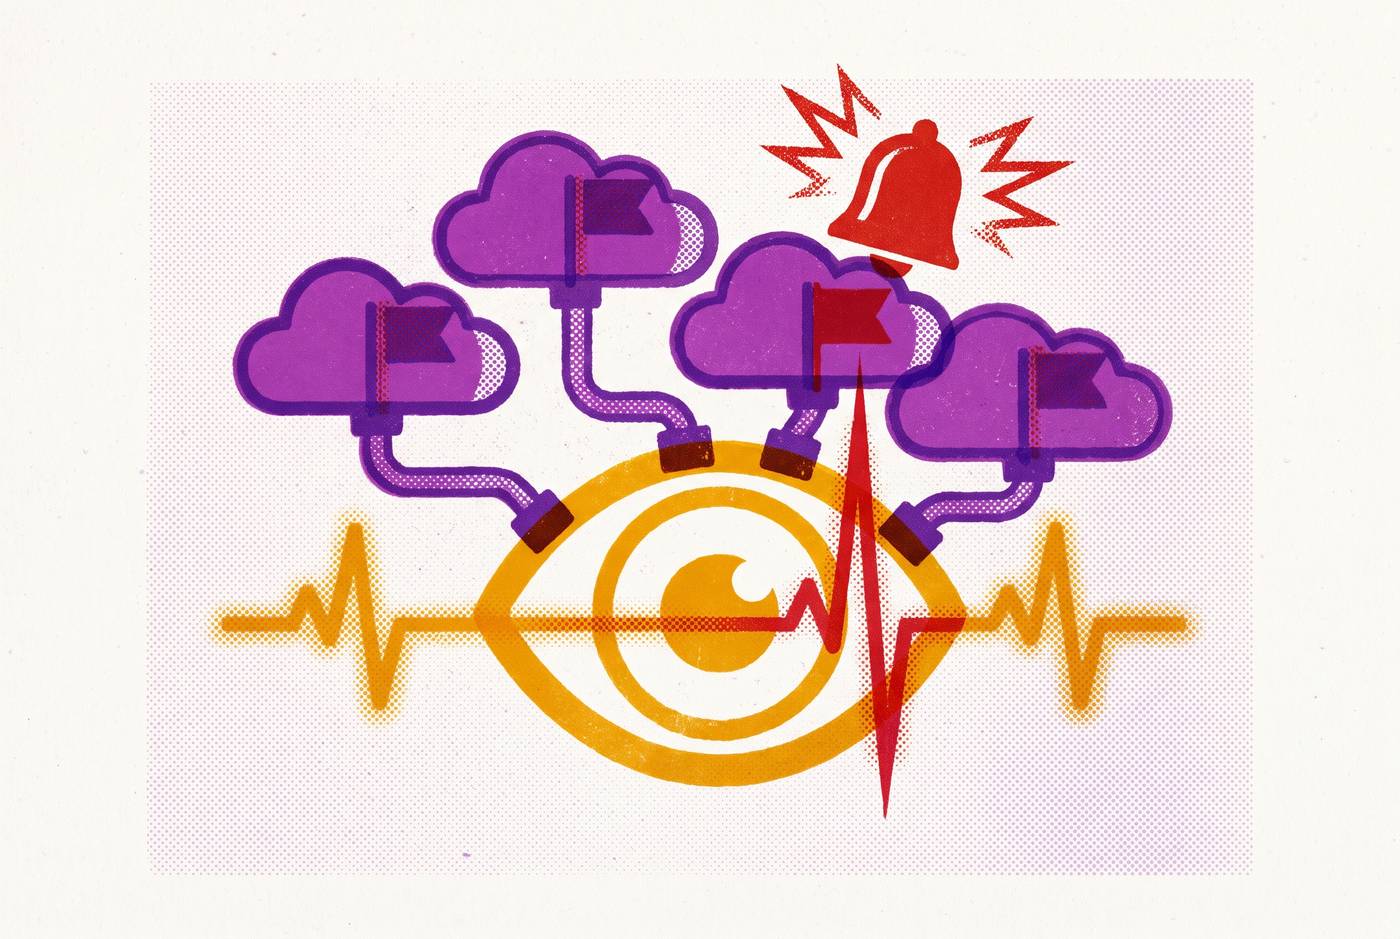
A central orchestration layer can route requests across OpenAI, Anthropic, and Google according to the task. A fast, cheap model does the classification and extraction, a mid-tier model does the standard generation, and a frontier model does the hard reasoning. That architecture creates more than a cost decision. Each active model endpoint becomes a separate dependency whose health cannot be inferred from another route.
A degraded GPT-4o path does not appear in a Claude or Gemini health check. Even models from the same provider need their own checks because partial outages can leave other endpoints working. Automatic fallback does not remove that obligation. Escalation to a stronger model when confidence is low is a routing feature that reacts after a problem.
Fallback can also keep calls working while the content gets worse. A degraded destination may return valid JSON with text that makes sense but is off-brand, leaving a standard monitor quite happy with work that is not good enough. Monitoring thus needs to cover both how the endpoint works and the quality of its output. A functional probe needs a minimal task with a checkable, known-good response.
Building a synthetic probe that treats output quality as the health signal
To cover that surface, build a separate synthetic probe for each model endpoint in the routing layer. Give it a minimal prompt whose correct output can be asserted, such as a response of 1–2 tokens or a fixed task with a known answer.
Validate the response against the API version the pipeline expects. For an endpoint using the choices structure, assert that the array exists and is non-empty, and that choices[0].message.content is a non-empty string. Then check the expected answer. These assertions distinguish a structurally valid response from a correct one, while the schema check catches changes that would break the consumer.
Measure generation latency against the endpoint’s role. A classification call that normally returns in 200ms should trigger concern well before the 5-second threshold appropriate for a full generation call. Keep each model’s results separate. Otherwise, healthy routes can conceal the very path the probe was built to watch.
For voice or style fidelity, extend the probe with an LLM-as-judge check against a known-good sample. A cascade can use a free or low-cost classifier to reject clearly wrong output, an LLM judge to review ambiguous cases against style criteria, and human escalation for edge cases. This shares infrastructure with a writing harness quality gate. Test cases and adversarial review councils serve writing as tests serve code, with a passing style assertion providing a test result.
Alerting that distinguishes silent degradation from full outages
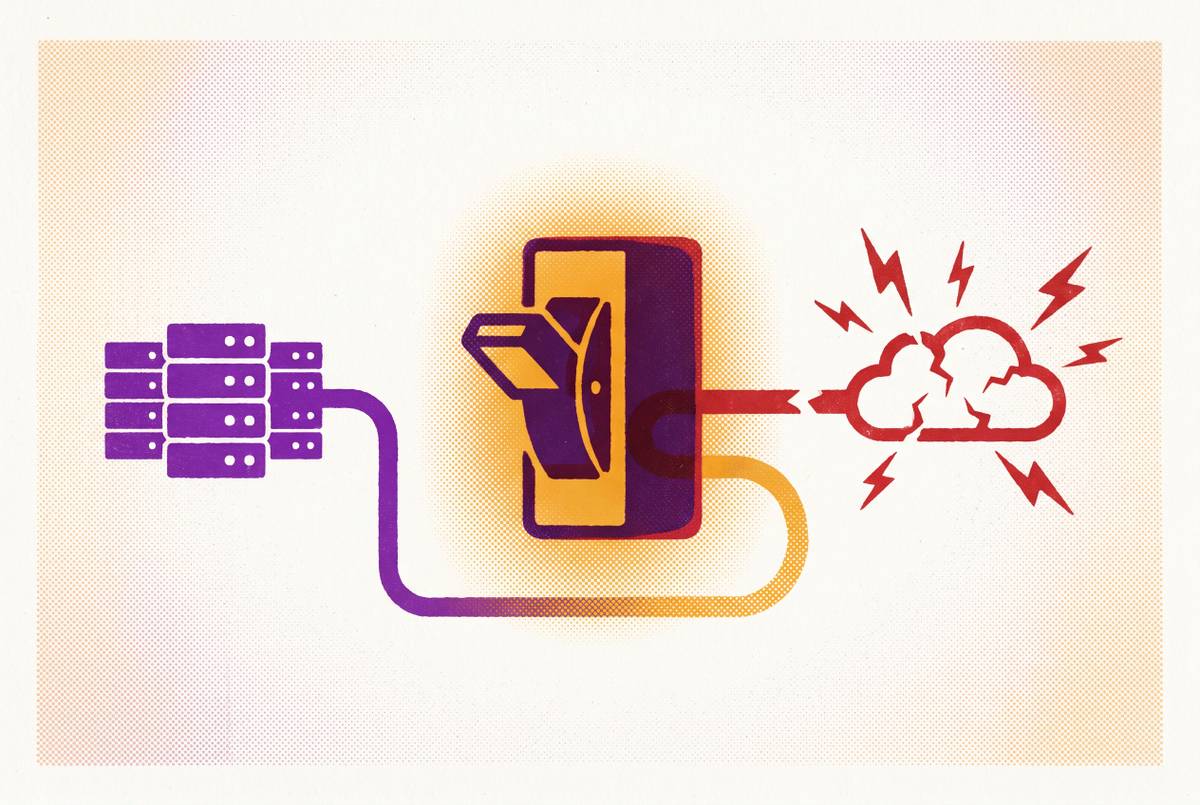
Once probes produce useful signals, route them by failure type and by who can act. An unreachable endpoint or 5xx response calls for an immediate page to the on-call engineer. A 200 response with an empty or malformed body deserves the same urgency.
Latency regressions need their own warning path. Alert when p95 crosses the endpoint’s threshold, because latency trends can signal trouble hours before a full failure. Rate limits should also trigger a warning as they draw near, with time for throttling or failover before requests start failing.
Schema drift should reach the engineer who owns the integration as a migration obligation, distinct from an outage alert. Output that passes schema validation but fails style or content assertions belongs with the content engineering team as well as infrastructure responders. An alert for a broken Stripe webhook goes to the payments engineer. A degraded Claude endpoint reaches whoever owns the content generation pipeline.
Sending everything to everyone creates noise, while sending it to the wrong person creates delay. Quality degradation is especially easy to leave unowned because many infrastructure teams have no established responder for it. Define that ownership when setting up the alert layer. Alert design is where monitoring becomes an operational commitment, with team process behind the infrastructure.
Tools that cover the monitoring layers AI pipelines actually need
No single tool covers the whole stack. A setup that works brings together synthetic monitoring, schema drift detection, distributed tracing, and a writing harness to check output quality. The choice depends on which signals the team lacks, rather than how many dashboard panels a product can supply. A dashboard does not get better just because it needs a bigger monitor.
Middleware provides endpoint monitoring with per-endpoint error rate, volume, and latency metrics, plus AI-powered alert suggestions. It supports zero-code auto-instrumentation through OpenTelemetry for Python, Node.js, Java,.NET, and Go. Datadog combines real-time API monitoring, anomaly detection, latency tracking, and distributed tracing. New Relic also has API performance monitoring and distributed tracing in its full-stack observability platform.
Grafana Cloud brings metrics, logs, and traces into a stack with roots in open source, so it fits teams that already use Prometheus well. Levo.ai combines real-time API monitoring with security posture enforcement, misconfiguration detection, and continuous governance across development, staging, and production. Their emphases differ, even where monitoring overlaps. Security governance and checks on performance answer related questions, but a content-quality assertion is still needed.
Rumbliq covers uptime, multi-step synthetic monitoring through Sequences, and schema drift detection using JSON schema fingerprints over time. OpenTelemetry is the open instrumentation standard that many tracing and real user monitoring products are built on. Instrumenting with it avoids vendor lock-in at the data collection layer. That separates the collection of evidence from the platform used to examine it.
Output quality still needs its own infrastructure. Monitoring tools can validate response shape without establishing whether the text is on-brand, stylistically correct, or convergent with a team’s voice. A writing harness with adversarial review and post-trainable voice kernels addresses that gap. It complements infrastructure monitoring rather than replacing checks on availability, latency, schema, or request flow.
What good monitoring changes about how content pipelines are built
A style probe requires explicit style assertions, which many teams do not have until they try to monitor quality. Writing those assertions changes the pipeline’s specification. Used with a brand corpus, they become raw material for post-training a voice-specific writing kernel, bringing voice out of the generic prompts where it was buried. Monitoring and training start to share a definition of correct output.
Over time, output-quality checks accumulate a ground truth dataset of passing and failing responses. That dataset supports voice-specific fine-tuning and adversarial council training. Multiple models checking one another are also performing a form of monitoring, with repeated review directed toward convergence. Quality control is no longer only a gate at the end. It helps shape how the writing system learns and operates.
The parallel with API engineering is exact enough to be useful. Schema drift and style drift both require a baseline, a continuous check, and an alert when output departs from the specification. Teams treating writing as an engineering problem already have a place for test cases, quality gates, and ownership. Monitoring then becomes a design constraint that produces better pipelines.